
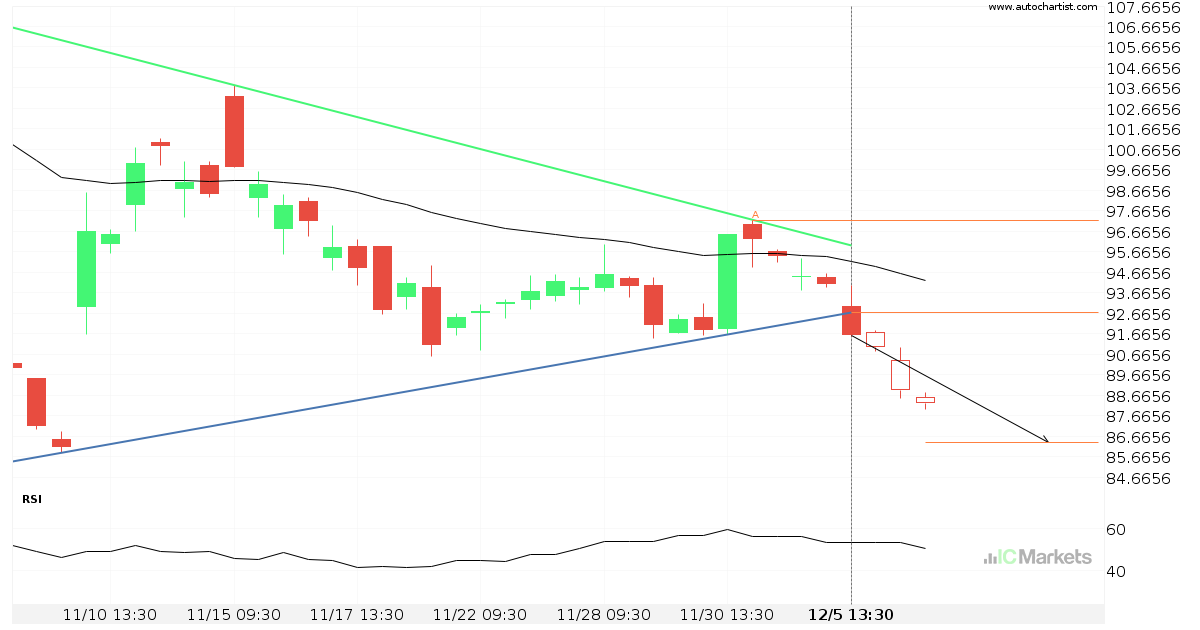
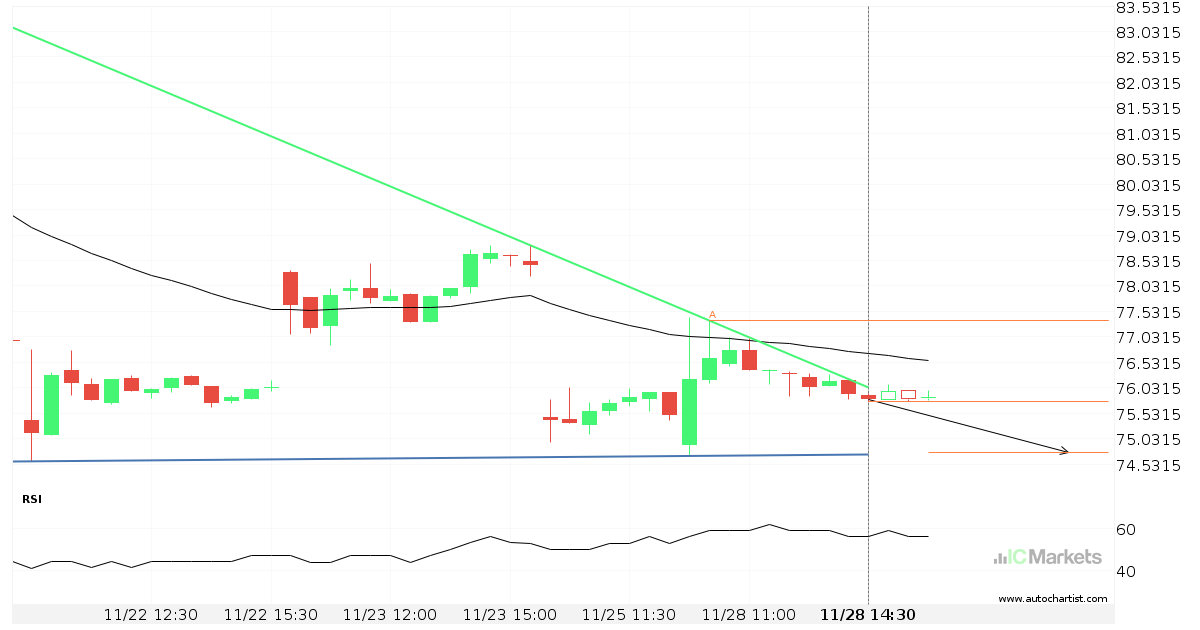
Possibility of big movement expected on Amazon.Com Inc.
Amazon.Com Inc. has broken through a support line of a Triângulo and suggests a possible movement to 86.3827 within the next 12 hours. It has tested this line in the past, so one should probably wait for a confirmation of this breakout before taking action. If the breakout doesn’t confirm, we could see a retracement […]
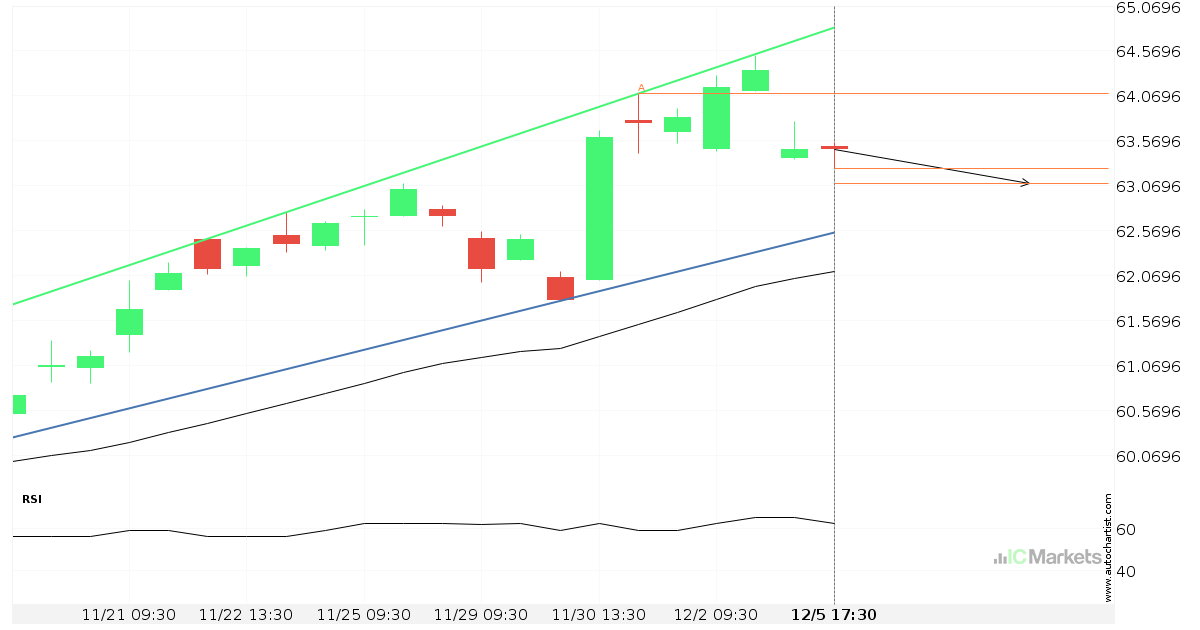
Will Coca-Cola Co. have enough momentum to break support?
Coca-Cola Co. is heading towards the support line of a Canal ascendente and could reach this point within the next 2 days. It has tested this line numerous times in the past, and this time could be no different from the past, ending in a rebound instead of a breakout. If the breakout doesn’t happen, […]
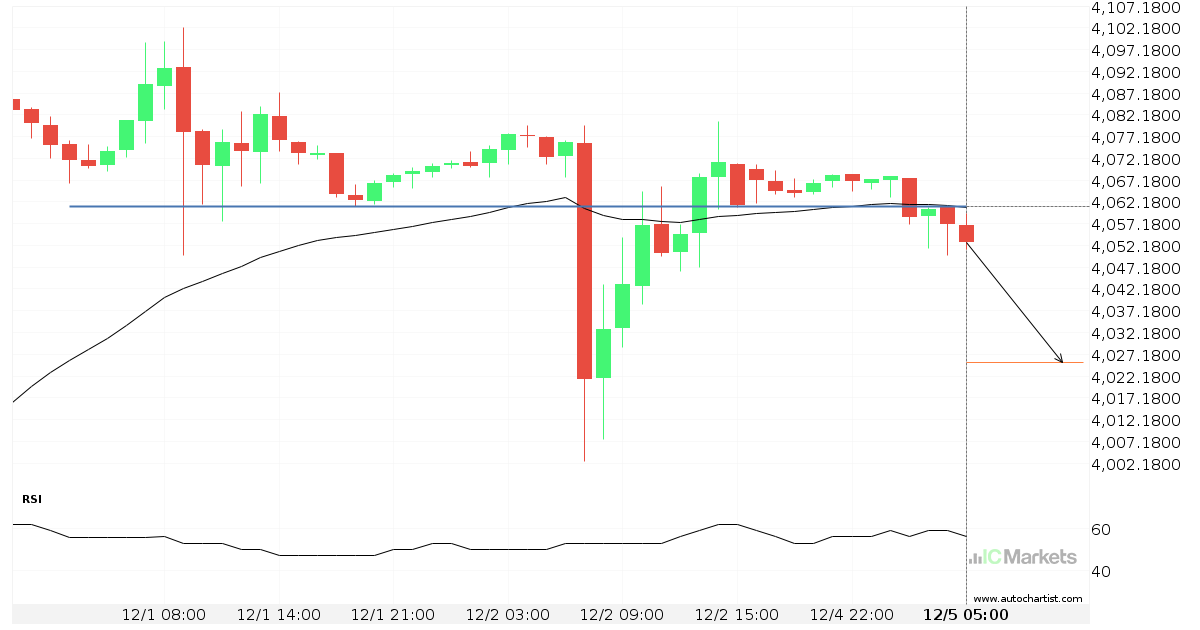
Big movement possible on US SPX 500 Index
US SPX 500 Index has broken through a line of 4061.2000 and suggests a possible movement to 4025.3799 within the next 11 hours. It has tested this line numerous times in the past, so one should wait for a confirmation of this breakout before taking any action. If the breakout doesn’t confirm, we could see […]
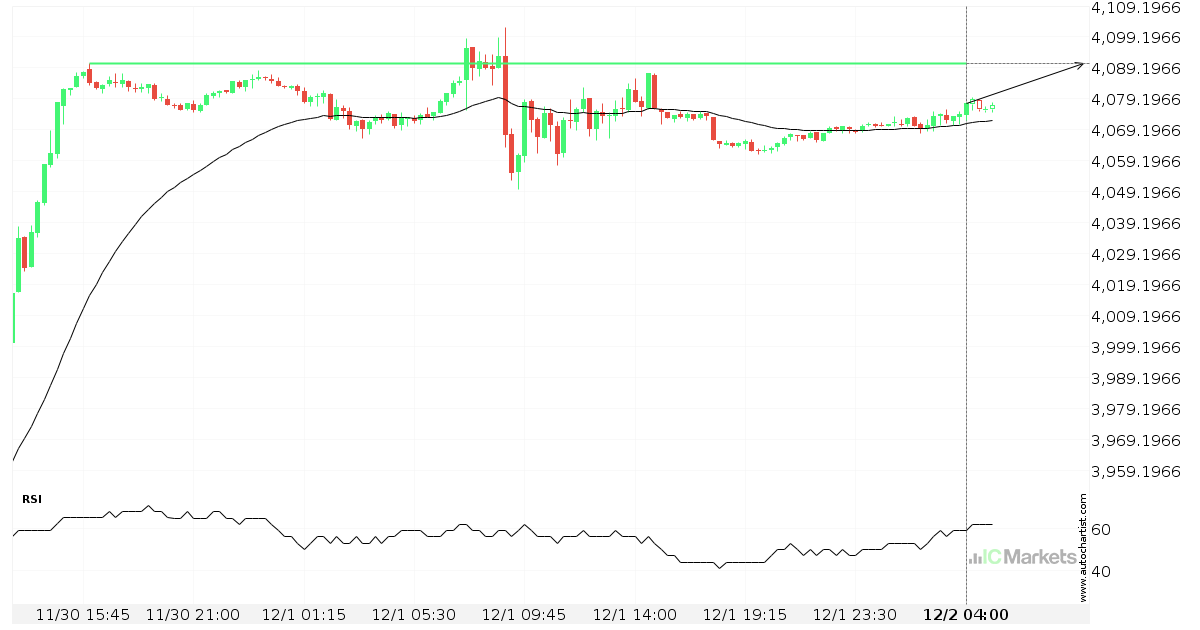
A final push possible on US SPX 500 Index
US SPX 500 Index is heading towards 4090.6001 and could reach this point within the next 7 hours. It has tested this line numerous times in the past, and this time could be no different, ending in a rebound instead of a breakout. If the breakout doesn’t happen, we could see a retracement back down […]
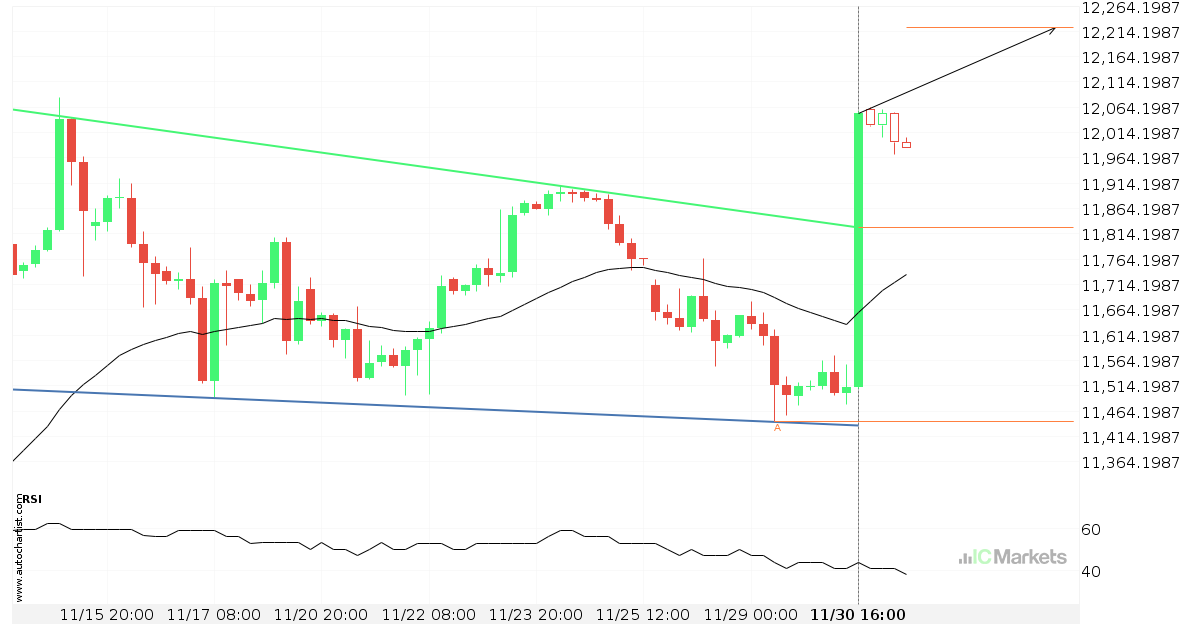
Resistance line breached by US Tech 100 Index
US Tech 100 Index has broken through the resistance line which it has tested twice in the past. We have seen it retrace from this line before, so one should wait for confirmation of the breakout before trading. If this new trend persists, a target level of around 12221.3756 may materialize within the next 3 […]
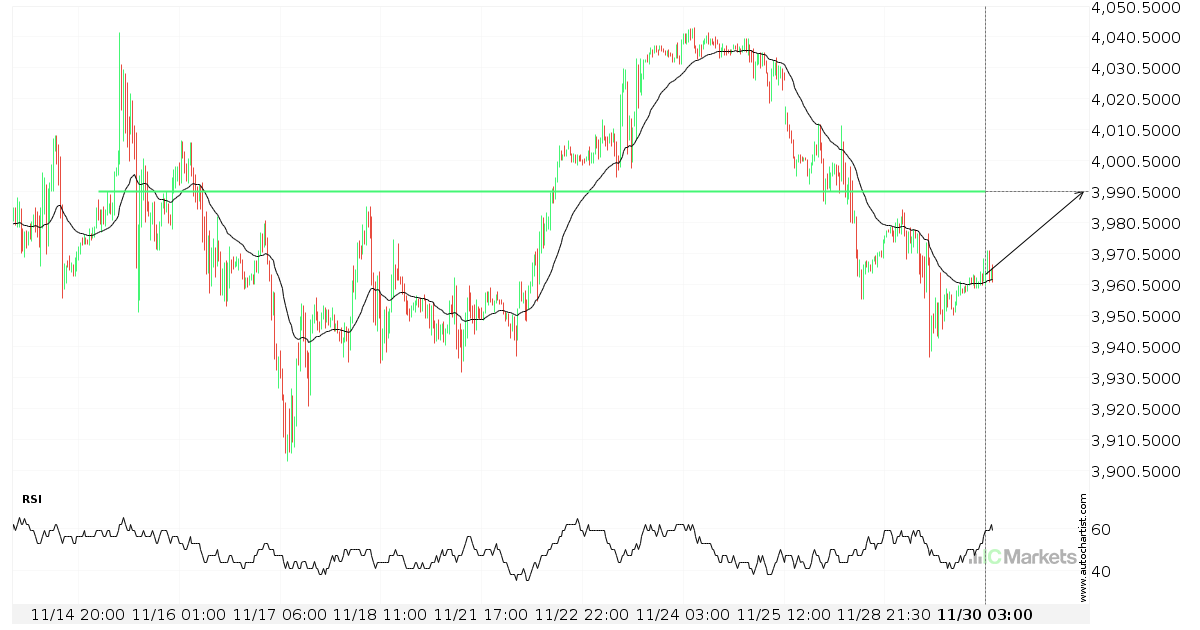
A final push possible on US SPX 500 Index
US SPX 500 Index is heading towards 3990.7000 and could reach this point within the next 3 days. It has tested this line numerous times in the past, and this time could be no different, ending in a rebound instead of a breakout. If the breakout doesn’t happen, we could see a retracement back down […]
Alibaba Group Holding Limited – getting close to support of a Triângulo Descendente
Alibaba Group Holding Limited is moving towards a support line. Because we have seen it retrace from this line before, we could see either a break through this line, or a rebound back to current levels. It has touched this line numerous times in the last 12 days and may test it again within the […]
Possible start of a bullish trend on US Tech 100 Index
US Tech 100 Index has broken through a line of 11862.9004. If this breakout holds true, we could see the price of US Tech 100 Index heading towards 12005.8799 within the next 2 days. But don’t be so quick to trade, it has tested this line numerous times in the past, so you should probably […]
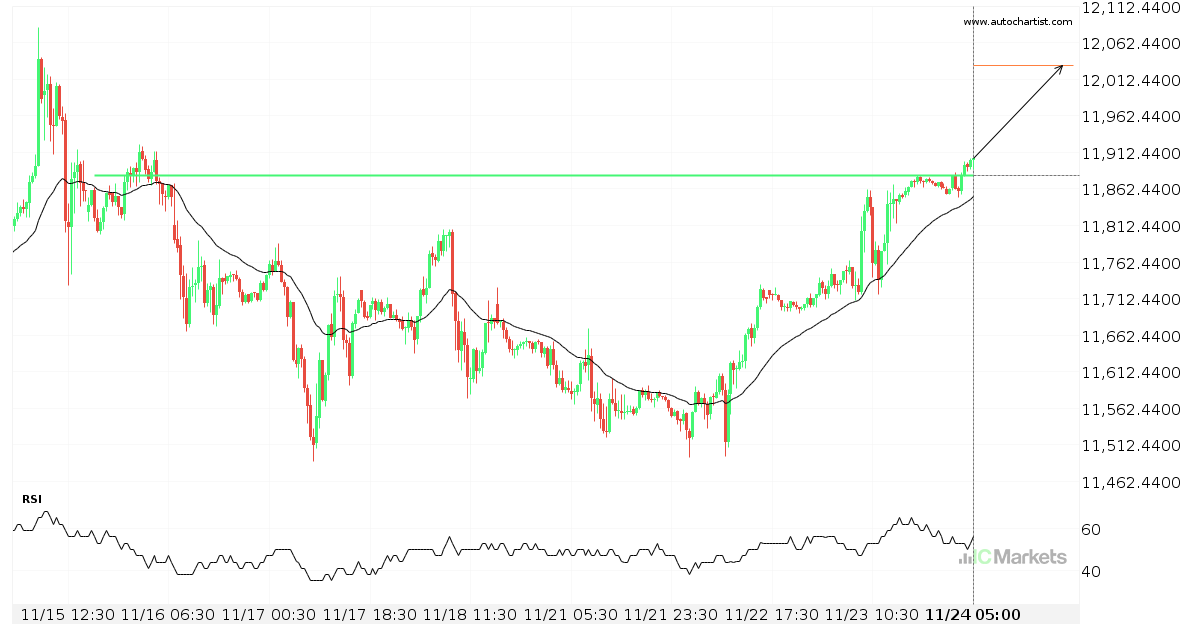
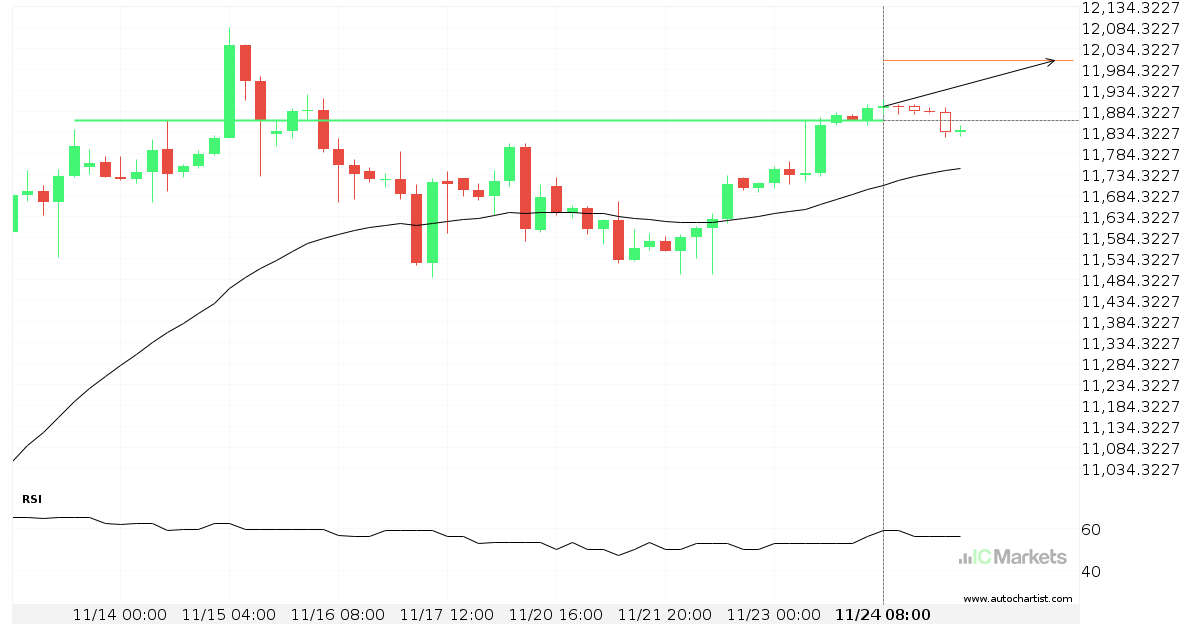
US Tech 100 Index broke through important 11880.2002 price line
US Tech 100 Index has broken through a resistance line. It has touched this line numerous times in the last 9 days. This breakout shows a potential move to 12031.6299 within the next 2 days. Because we have seen it retrace from this level in the past, one should wait for confirmation of the breakout.
Possible breach of resistance level by US Small Cap 2000 Index
US Small Cap 2000 Index is moving towards a resistance line which it has tested numerous times in the past. We have seen it retrace from this line before, so at this stage it isn’t clear whether it will breach this line or rebound as it did before. If US Small Cap 2000 Index continues […]